- Primary data are collected for a current investigation; secondary data come from existing sources.
- A census aims to cover the full target population, while a sample survey studies selected units.
- Sampling frames must cover the target population without systematic omissions or duplicates.
- Probability sampling includes simple random, systematic, stratified and cluster designs.
- Convenience and other nonprobability samples can introduce selection bias.
- Neutral questionnaires, pilot testing and clear reference periods improve measurement quality.
- Sampling, nonresponse, coverage and measurement errors require careful reporting and ethical handling.
Use these notes alongside your current textbook. Check important formulas, worked answers and syllabus coverage with your teacher or official learning material.
Collection of Data , Class 11 Economics
Original supplementary 2026, 27 Statistics for Economics guide covering primary and secondary data, census and sample methods, questionnaire design, survey errors and ethics, with 40 worked examples.
Meaning of data collection
Data collection is the systematic gathering of observations about defined units and variables to answer a research question. A reliable investigation specifies its purpose, target population, time period and units.
Why economists collect data
Economic surveys measure income, spending, prices, work, production and access to services. Evidence supports description and decisions but cannot replace careful causal reasoning.
Statistical enquiry
A statistical enquiry begins with a question, population, variables, collection plan, quality controls, analysis and communication of limitations.
Defining a research question
A precise question such as 'What fraction of households in Ward A used public transport last week?' is more measurable than 'Do people like transport?'.
Target population
The population is the entire set of units to which findings should apply, such as all households in a defined village on a specified date.
Statistical unit
A unit may be a person, household, firm, school or transaction. Mixing units can produce misleading denominators.
Variables and indicators
A variable is a measured characteristic such as monthly spending; an indicator is an operationally defined summary such as the proportion of households with electricity.
Primary data
Primary data are collected for the current study, using surveys, interviews, direct observation or experiments as appropriate.
Secondary data
Secondary data already exist, such as published survey tables or administrative records, and must be assessed for relevance and reliability.
Primary versus secondary choice
Primary collection gives greater control over definitions but may be costly. Secondary data are often faster but may use unsuitable categories or outdated coverage.
Internal and external secondary sources
Internal records include an organisation's sales or attendance; external sources include government statistical reports, research datasets and published studies.
Evaluating secondary sources
Check author, collection date, population, methodology, definitions, geographic coverage, missing data, revisions and whether the source is authoritative.
Census method
A census attempts to observe every unit in the target population; full enumeration can be costly and still suffer errors.
Sample survey
A sample survey observes a subset of the population. Appropriate design and response are essential before generalising.
Census versus sample
Censuses can offer detailed coverage but require substantial resources; samples may be quicker and less costly, with sampling uncertainty.
Sampling frame
A sampling frame is the operational list or procedure used to select units. Missing or duplicated units can introduce coverage error.
Sampling fraction
Sampling fraction is n/N where n is sample size and N is the number of units in the frame.
Probability sampling
In probability sampling, units have known nonzero selection probabilities, permitting design-based statistical inference under assumptions.
Simple random sampling
A simple random sample of fixed size gives each possible subset of that size an equal chance of selection.
Lottery method
Assign unique identifiers and draw without replacement using a fair random mechanism; avoid favouring convenient or familiar units.
Random-number selection
A reproducible random-number method can select unit IDs, with duplicate handling and the selection seed documented.
Systematic sampling
After a random start, select every kth unit in an ordered frame; periodic patterns in the list may bias results.
Stratified sampling
Divide the population into mutually exclusive strata such as urban and rural groups, then sample within each stratum.
Proportionate stratified allocation
When proportional allocation is appropriate, sample size in stratum h is n × Nh/N, with practical rounding and total-size checks.
Cluster sampling
Select groups such as villages or schools, then survey all or some units within selected clusters; analysis must account for clustering.
Multistage sampling
A design may select districts, then villages, then households. Inclusion probabilities and weights matter for estimates.
Nonprobability sampling
Convenience, purposive and quota approaches do not automatically support probability-based generalisation to a population.
Convenience sampling
Selecting whoever is easy to contact can systematically exclude groups and introduce selection bias.
Purposive sampling
Researchers deliberately select informative cases for a defined purpose, often useful for qualitative insight but not necessarily representative rates.
Quota sampling
A survey may target fixed counts for categories without randomly selecting within them; quotas alone do not remove selection bias.
Sample size considerations
Precision depends on sample size, variability, design, response and desired confidence; large biased samples can remain inaccurate.
Sampling error
Sampling error is the difference between a sample estimate and population quantity arising from observing only a subset.
Nonsampling error
Coverage gaps, nonresponse, inaccurate answers, interviewer effects, data entry errors and processing errors can occur in both samples and censuses.
Coverage error
Coverage error occurs when the frame omits eligible units or includes ineligible or duplicate units.
Nonresponse error
Unit nonresponse occurs when selected units do not participate; item nonresponse occurs when a respondent skips a question.
Response bias
Respondents may misremember, misinterpret or deliberately misreport information, especially on sensitive topics.
Interviewer bias
Tone, wording, prompts or expectations of an interviewer may influence answers; neutral training helps reduce this risk.
Recall bias
People may inaccurately remember purchases or work hours over long reference periods; shorter recall windows can help.
Measurement error
Unclear definitions, poor instruments or inconsistent recording create differences between observed and true values.
Pilot survey
A small pilot tests question wording, length, logistics, translations and response options before main collection.
Questionnaire
A questionnaire is a structured set of questions designed to collect comparable information from respondents.
Good questionnaire design
Use short, neutral, unambiguous wording, logical order, clear reference periods and mutually exclusive response categories where appropriate.
Open-ended questions
Open-ended questions allow respondents to answer freely but require careful coding and can be difficult to compare.
Closed-ended questions
Closed-ended questions offer defined choices, facilitating tabulation but potentially missing unanticipated answers.
Leading questions
Questions that imply a preferred answer can bias responses; replace 'Don't you agree?' with neutral alternatives.
Double-barrelled questions
A question asking whether transport is cheap and reliable combines two attributes and should be split.
Response categories
Categories should avoid overlap and include relevant options such as 'other', 'not applicable' or 'prefer not to answer' when appropriate.
Interview method
Interviews may be face-to-face, telephone or online, with trade-offs in cost, coverage, response quality and privacy.
Personal interview
Face-to-face interviews permit clarification but can be costly and introduce interviewer effects.
Telephone interview
Telephone surveys can be quicker but exclude people without reachable phone access and may have high nonresponse.
Online survey
Online forms are inexpensive to distribute but may exclude people without internet access or digital literacy.
Direct observation
Observation records visible behaviour or conditions without relying entirely on self-report; it may miss motives and private activities.
Administrative records
School, tax or service records can be useful secondary data but reflect administrative definitions and coverage.
Questionnaire versus schedule
In textbook terminology, respondents may complete a questionnaire themselves, while an enumerator fills a schedule during an interview; usage can vary.
Enumerators
Enumerators collect responses following standard instructions, consent practices and verification procedures.
Data confidentiality
Collect only necessary personal information, restrict access, use secure storage and report aggregates where possible.
Informed participation
Explain the survey purpose, expected use, voluntary nature and privacy safeguards; use appropriate consent procedures.
Student survey safety
Avoid collecting unnecessary sensitive information about classmates; obtain institutional permission and appropriate consent for school projects.
Coding responses
Assign consistent codes to categories and maintain a codebook; distinguish 'missing', 'not applicable' and a genuine zero.
Data validation
Check allowed ranges, duplicates, impossible combinations, missing values and consistency before analysis.
Survey weights
Weights may adjust for unequal selection probabilities or response patterns; weighting cannot fix every source of bias.
Response rate
A simple response rate is completed eligible interviews divided by eligible selected units, with more precise definitions used in formal surveys.
Data quality dimensions
Assess accuracy, relevance, timeliness, completeness, consistency, representativeness and transparency.
Reporting methodology
State population, sampling frame, dates, selection method, sample size, response rate, question wording and major limitations.
Indian economic sources
Official Indian statistical and administrative sources may include government survey reports and central-bank publications; check their latest methodology and release dates.
Choosing a method
Match method to the question, budget, time, target population, sensitivity and precision needed rather than assuming one approach is always best.
Revision checklist
Revise primary and secondary sources, census versus sample, probability and nonprobability methods, questionnaire design, response errors and ethical reporting.
Worked example 1: Sample fraction
Select 50 households from a frame of 500: n/N = 50/500 = 0.10, or 10%.
Worked example 2: Census or sample
Survey all 240 shops in a market: census of those shops; survey 60 of them: sample.
Worked example 3: Target population
If the question concerns all students in School A, surveying only Class 11 students does not cover the intended population.
Worked example 4: Sampling frame gap
A voter list may omit newly eligible residents; its use as a frame can create undercoverage.
Worked example 5: Primary data
Interviewing 80 households for a new spending study produces primary data.
Worked example 6: Secondary data
Using a previously published household expenditure table is secondary-data analysis.
Worked example 7: Lottery sampling
Write IDs 1, 20 on identical slips and draw 5 without replacement for a simple random sample.
Worked example 8: Equal inclusion chance
In a simple random sample of 10 from 100, each unit's inclusion probability is 10/100 = 0.10.
Worked example 9: Systematic interval
For 200 ordered units and a sample of 20, the interval is 200/20 = 10; choose a random start from 1, 10.
Worked example 10: Systematic selection
With interval 10 and random start 4, select IDs 4, 14, 24 and so on through 194.
Worked example 11: Stratified allocation
Population has 600 rural and 400 urban units; a proportionate sample of 100 selects 60 rural and 40 urban.
Worked example 12: Stratified allocation 2
Population groups 300 and 700 with n=50 imply proportionate allocations 15 and 35.
Worked example 13: Cluster sampling
Randomly select 5 schools and survey students in those schools; observations within schools may be correlated.
Worked example 14: Convenience bias
Interviewing only people leaving a shopping mall may not represent all residents' shopping patterns.
Worked example 15: Online coverage
An online-only survey may exclude households without internet, biasing an estimate of internet access.
Worked example 16: Nonresponse count
Of 120 eligible sampled households, 90 complete interviews: 30 are nonrespondents.
Worked example 17: Response rate
90 completed eligible interviews among 120 eligible selections gives a simple response rate of 75%.
Worked example 18: Item nonresponse
A respondent answers all questions except income; the income value is missing, not zero.
Worked example 19: Leading question
Replace 'How excellent is the new bus service?' with 'How would you rate the bus service?'.
Worked example 20: Double-barrelled item
Replace 'Is the bus affordable and punctual?' with separate affordability and punctuality questions.
Worked example 21: Reference period
Ask 'How much did you spend on groceries in the past seven days?' instead of 'How much do you usually spend?'.
Worked example 22: Mutually exclusive ages
Use age bands 10, 14 and 15, 19, not 10, 15 and 15, 20, if every respondent must fit exactly one band.
Worked example 23: Open response
'What is the main difficulty with public transport?' allows unanticipated answers but requires coding.
Worked example 24: Closed response
'Which mode do you use most: bus, bicycle, walk, other?' is easier to tabulate but may constrain answers.
Worked example 25: Unit error
Record monthly household income in rupees, not mix monthly and annual amounts without conversion.
Worked example 26: Range check
A reported age of 250 years should be flagged for verification rather than silently accepted.
Worked example 27: Duplicate record
Two records with the same survey ID require checking before counting as two households.
Worked example 28: Missing versus zero
Zero travel spending differs from unanswered travel spending; keep distinct codes.
Worked example 29: Pilot survey
Test 10 interviews to find confusing wording before launching 200 interviews.
Worked example 30: Observation
Counting vehicles crossing a junction for 30 minutes is direct observation.
Worked example 31: Administrative data
Using school attendance registers is secondary administrative data for an external student researcher.
Worked example 32: Recall error
Asking respondents to recall every purchase from two years ago risks substantial recall error.
Worked example 33: Interviewer influence
A surveyor praising one policy before asking approval may bias answers.
Worked example 34: Sampling variability
Two independent random samples from one town can yield different employment estimates even without measurement error.
Worked example 35: Large biased sample
A survey of 10,000 app users may still misrepresent residents without smartphones.
Worked example 36: Privacy
Publish aggregated counts rather than names and exact incomes of classmates.
Worked example 37: Data cleaning
A dataset with expenditure values 500, 700 and −200 should flag the negative value for investigation.
Worked example 38: Weighted share
If groups have population sizes 100 and 300 and rates 20% and 40%, overall rate is (100×0.2+300×0.4)/400 = 35%.
Worked example 39: Survey estimate
In a representative sample of 200, 120 prefer buses: sample proportion = 120/200 = 60%, with sampling uncertainty.
Worked example 40: Reporting limitation
A survey conducted only during working hours may miss workers absent from home; disclose the limitation.
Essential formulas
Sampling fraction = sample size/population-frame size. Simple response rate = completed eligible interviews/eligible selected units × 100. Sample proportion = observed units with characteristic/sample size. Proportionate stratum allocation = total sample × stratum population/total population, with appropriate rounding.
Practice MCQs
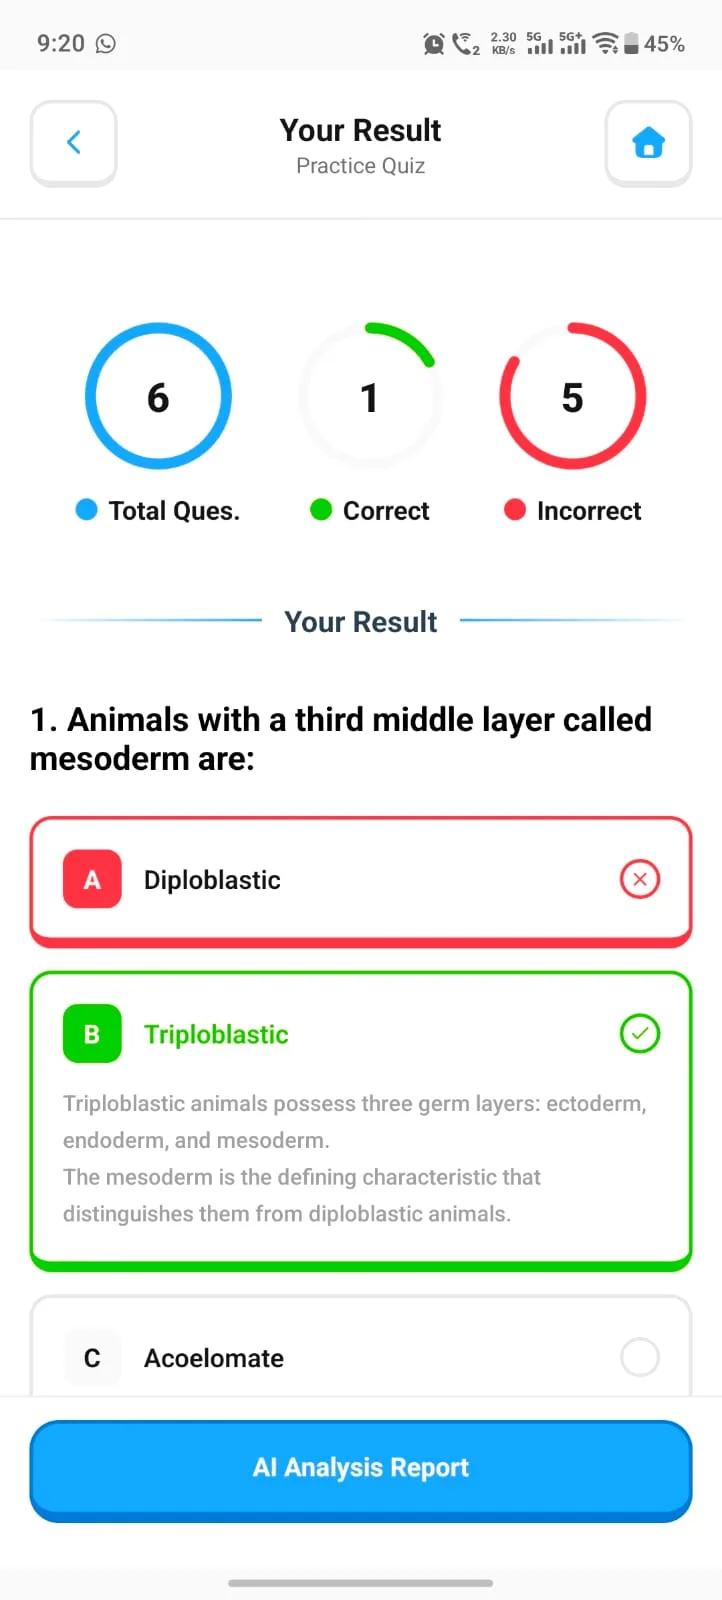
1. A sample is (a) entire population (b) selected subset. Answer b. 2. A newly conducted student survey yields (a) primary (b) secondary data. Answer a. 3. A frame excluding remote villages risks (a) coverage bias (b) perfect representativeness. Answer a. 4. A lottery with equal subset probabilities is (a) simple random sampling (b) convenience sampling. Answer a. 5. A questionnaire asking two things at once is (a) double-barrelled (b) neutral. Answer a. 6. A response left blank should be coded as (a) zero (b) missing. Answer b.
Short-answer practice
Q1: Distinguish primary and secondary data. Q2: Explain census versus sample. Q3: Define sampling frame and coverage error. Q4: Compare questionnaire and interview. Q5: Give two ways to reduce nonresponse bias.
Long-answer practice
1. Design a survey of student commuting methods with population, frame, sampling and five neutral questions. 2. Compare simple random, systematic, stratified and cluster sampling. 3. Explain sampling and nonsampling errors with examples. 4. Evaluate secondary data for source, period and coverage. 5. Describe ethical handling of identifiable survey responses.
Common mistakes
A large sample is not automatically representative. A census is not error-free. Random sampling requires a defensible selection process. A missing response is not a zero. Proportional allocation does not guarantee response rates. Online convenience surveys should not be generalized to all residents without justification.
Revision checklist
Know definitions, survey steps, primary/secondary sources, census/sample, probability/nonprobability methods, frame and response errors, questionnaire design, ethics, formulas and example calculations.
Source and scope note
This is original supplementary content, not an official NCERT reproduction or verified numbered exercise solution. Exact textbook-edition alignment and CBSE 2026, 27 examinable topics require separate verification. No guaranteed examination marking allocations or unverified app capabilities are claimed. References: https://cbseacademic.nic.in/curriculum_2027.html and https://ncert.nic.in/textbook.php.
Frequently asked questions
What is collection of data in economics?
The systematic gathering of observations about defined units and variables to answer an economic research question.
What is the difference between primary and secondary data?
Primary data are collected for the current enquiry; secondary data already exist from other collection efforts.
How does a census differ from a sample survey?
A census aims to include all target units, while a sample survey selects a subset.
What is simple random sampling?
A fixed-size sampling method in which every possible subset of that size has an equal probability of selection.
What is stratified sampling?
Dividing the population into nonoverlapping groups and sampling units within each group.
What is sampling bias?
A systematic distortion arising when selection or coverage makes observed units unrepresentative of the intended population.
How do you prepare a good questionnaire?
Use neutral, clear questions, defined time periods, logical order and suitable response options, then pilot test.
Are these official NCERT exercise solutions?
No. These are original supplementary explanations and examples; exact exercise alignment requires separate verification.